


When summer gives way to fall, many households expect their electricity bills to drop. Often they do—but not always, and not by the same amount everywhere.
The main reason is simple: air conditioning is one of the largest weather-sensitive uses of electricity in many homes. As temperatures and humidity fall in September and October, air conditioners and fans run less often. Heating and lighting begin to increase, but they generally do so more gradually. That creates a “shoulder season”—a period between summer cooling and winter heating when household electricity use and overall grid demand are often lower. EIA data show this cooling decline clearly, while electricity used for space heating generally begins rising later in the fall.
Fall is a shoulder season for your electricity bill as well as for the weather.
That broad pattern applies in New York, Minnesota, Maryland, Illinois and Massachusetts. But local climate, air-conditioning prevalence and—especially—the way homes are heated can make each state’s transition look different.
Cooling falls faster before heating fully arrives
The U.S. Energy Information Administration’s 2020 Residential Energy Consumption Survey provides the latest available month-by-month state estimates. Across the five states, average household electricity consumption declined substantially between August and October in all five states. Minnesota was the exception to the otherwise steady descent: its estimated use bottomed out in September and began rebounding in October.

Jump to your state to see the change in electricity usage during the fall:
New York Average Household Electricity Usage*
August
740 kWh
September
566 kWh
October
472 kWh
-36.2% Change from August to October
Cooling declines; much heating remains outside the electric bill
Minnesota Average Household Electricity Usage*
August
876 kWh
September
626 kWh
October
698 kWh
-20.3% Change from August to October
Earlier heating conditions can interrupt the fall decline
Maryland Average Household Electricity Usage*
August
1,177 kWh
September
821 kWh
October
690 kWh
-41.4% Change from August to October
Large cooling-related drop
Illinois Average Household Electricity Usage*
August
927 kWh
September
606 kWh
October
534 kWh
-42.4% Change from August to October
Sharp September decline, then a relatively flat October
Massachusetts Average Household Electricity Usage*
August
780 kWh
September
559 kWh
October
479 kWh
-38.6% Change from August to October
Lower cooling demand and substantial non-electric heating exposure
*Average monthly electricity per primary occupied housing unit. Percent changes are calculated from EIA Table CE8.5.M.2020. These are survey-based and modeled estimates for 2020—not a climatological normal, a 2024 estimate or a forecast for an individual household. EIA includes electricity from on-site solar generation and excludes vacant, seasonal and second homes.
The strongest estimated August-to-October declines occurred in Illinois, Maryland and Massachusetts, followed by New York. Minnesota’s September low and October rebound support the conclusion that colder conditions—and the start of the heating season—typically arrive there earlier.
The end-use data explain the shape. In every state, modeled cooling electricity falls sharply after August. Illinois and Maryland had particularly large late-summer cooling loads, while Minnesota’s cooling demand was substantially lower by October. Electric space heating then begins adding load, but its timing and magnitude depend heavily on the home’s heating equipment and fuel. In practical terms, many households stop running air conditioning well before they begin heating continuously.
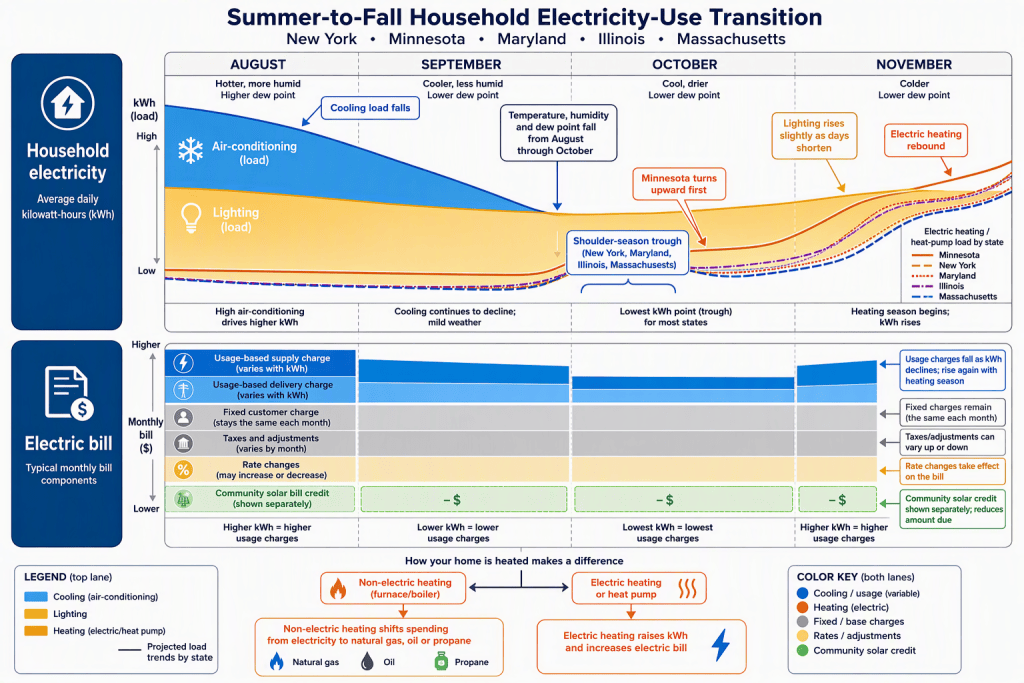
Figure 1: Fall bills reflect two separate changes: how many kilowatt-hours a household uses and how the utility prices and credits those kilowatt-hours. Cooling usually declines first, while heating type determines whether electric use later rebounds.
Why the five states differ in changes in electricity consumption
Air conditioning is common in every state in this comparison, but the equipment mix varies. RECS estimated that 96% of Illinois homes, 94% of Minnesota homes, 91% of Maryland homes, 88% of New York homes and 87% of Massachusetts homes used some form of air conditioning in 2020. Central-air prevalence was especially high in Maryland, Illinois and Minnesota, while window, wall and other individual units were more common in New York and Massachusetts.
That helps explain why Maryland and Illinois showed the steepest household declines in the available estimates. Maryland combines widespread central air conditioning with relatively warm, humid late summers. Illinois can also carry significant cooling demand through August, followed by a rapid drop when cooler and less humid air arrives. In both states, fewer cooling-degree days—and particularly lower dew points—can reduce air-conditioning runtime quickly.
Minnesota usually reaches heating conditions earlier. The state’s cooling load falls in September, but colder nights can bring heating demand back sooner than in the other four states. That does not necessarily mean a large electric increase, because RECS estimated that natural gas was the main heating fuel in 68% of Minnesota homes, compared with 14% using electricity and 15% using propane. Still, heat-pump and electric-resistance homes may see electricity consumption rebound as temperatures fall.
Heating fuel then determines how colder weather appears on the electric bill. The latest state-level RECS fuel figures are still from 2020:
- In Minnesota, an estimated 68% of homes used natural gas as their main heating fuel, 15% used propane and 14% used electricity.
- In Illinois, approximately 78% used natural gas and 17% used electricity.
- In New York, approximately 61% used natural gas, 17% used fuel oil and 16% used electricity.
- In Massachusetts, approximately 53% used natural gas, 24% used fuel oil and 17% used electricity.
- Maryland had the highest electric-heating exposure of the five states: approximately 41% used electricity and 49% used natural gas.
New York and Massachusetts have particularly important non-electric heating exposure. This creates an important distinction. Minnesota may become cold first, but much of its heating energy is purchased as natural gas or propane rather than electricity. Maryland often remains warmer later, but its larger electric-heating share means that a cold spell can have a more visible effect on household kWh. In New York, Massachusetts and Illinois, colder weather may initially shift spending toward gas or oil rather than sharply increasing electricity use.
Shorter days add some lighting demand, but the effect is now comparatively small. EIA’s preliminary 2024 RECS results show that 90% of U.S. households used LEDs, 63% used mostly LEDs and 37% used LEDs for all indoor lighting. Efficient lighting reduces the electricity effect of longer fall evenings. Consistent with PureSky’s article on Daylight Saving Time, modern daylight-saving-time effects are generally much smaller than weather-driven heating and cooling changes.
Household electricity use is not the same as total grid demand
Regional grid operators see the same weather transition at a much larger scale. NYISO serves New York; ISO New England covers Massachusetts; PJM covers Maryland and part of Illinois; and MISO covers Minnesota and part of Illinois. PJM explicitly spans all or parts of both Maryland and Illinois, so Illinois cannot be described accurately using a single grid operator.
Grid demand includes homes, offices, factories, schools, data centers and other users. It is often discussed as megawatts at a particular moment, while a household bill records kilowatt-hours accumulated over a billing period. ISO New England also distinguishes underlying or “gross” load from net load after behind-the-meter solar and other resources. A mild, sunny October afternoon can therefore produce very low visible grid demand without implying that every household’s electricity use fell by the same proportion.
The consumer takeaway is simple: hot, humid weather raises both household cooling use and regional demand. Mild fall weather usually reduces both—but regional grid totals should not be treated as state-level residential consumption.
Which electric appliance use the most electricity?
How can I understand my electricity usage?
What lower usage can—and cannot—do to a bill
A lower-kWh month can reduce the usage-dependent portion of an electric bill. Supply charges are commonly calculated using the amount of electricity consumed, and many delivery charges also include a per-kWh component. But bills can also include fixed customer charges, tariff adjustments, taxes, fees and other charges that do not fall in direct proportion to usage.
Massachusetts’ consumer guidance, for example, describes a bill as a combination of supply charges, delivery charges, per-kWh rates and a fixed monthly customer charge.
That means using less electricity does not guarantee a lower total bill. The result also depends on:
- the supply rate charged during the billing period;
- per-kWh and fixed delivery charges;
- rate or tariff changes;
- the number and weather conditions of days in the billing cycle;
- taxes, riders and utility adjustments;
- community-solar credits and savings; and
- whether space heating is electric.
EIA notes that electricity prices reflect generation, fuel, transmission, distribution, weather and regulatory costs. Those factors can change independently of a household’s consumption. A home could use 15% fewer kilowatt-hours yet receive a smaller bill reduction if its price per kWh increased. Conversely, stable rates combined with sharply lower air-conditioning use could produce a more noticeable decline.
Heating type matters just as much. A gas-, oil- or propane-heated household may see its electric bill remain low while another fuel bill rises. A home using a heat pump or electric-resistance heating may see electric consumption rebound as outdoor temperatures fall.
Heating type matters just as much. A gas-, oil- or propane-heated household may see its electric bill remain low while another fuel bill rises. A home using a heat pump or electric-resistance heating may see electric consumption rebound as outdoor temperatures fall.
For community-solar customers, bill credits add another layer. Community-solar programs generally allocate credits associated with a subscribed share of a solar farm, but the timing, calculation and placement of those credits depend on the project, utility and applicable program rules. Credits should not be presented as a guaranteed one-for-one offset against a seasonal usage increase or as assurance that a particular month’s total bill will decline. Regardless of the electricity bill, there will always be guaranteed savings on community solar credits.
See if you qualify for community solar savings
How to understand your electricity bill
What El Niño could change in fall 2026
As of September 10, 2026, NOAA’s Climate Prediction Center had an El Niño Advisory in effect and reported that El Niño was strengthening, with a greater than 90% chance of a very strong event during fall and winter 2026–27. CPC also assigned a 75% chance that the October–December event would exceed the strength of previous El Niño events in the record dating to 1950.
That does not mean every week in these five states will be warm. Seasonal outlooks describe probabilities across a three-month period, not specific daily weather, and NOAA cautions that El Niño-related impacts are more likely—not guaranteed.
If fall 2026 is warmer than normal in a particular location, cooling could persist longer in September or early October, delaying the normal decline in electricity use. Later in the season, warmer conditions could also postpone the heating rebound. El Niño’s U.S. influence generally becomes more organized later in fall and winter, so early-fall electricity use may still be shaped more by local heat waves, humidity and cold fronts than by ENSO alone.
What customers should watch
The most useful indicators are close to home:
- Daily temperature and dew point: Humid heat can keep air conditioning running even when temperatures appear moderate.
- Cooling- and heating-degree days: These provide a better seasonal comparison than the calendar alone.
- Heating type: Gas, oil, propane, resistance heat and heat pumps affect electric bills differently.
- Monthly kWh: Compare usage—not just dollars—with the same billing period last year.
- Price per kWh and fixed charges: A bill can change because of rates even when usage falls.
- Community-solar credits: Review the credit separately from consumption and utility charges.
For many households, fall creates a welcome pause between summer cooling and winter heating. But the timing and depth of that pause depend on weather, equipment, heating fuel, rates and billing structure. The most reliable way to understand a fall bill is to look at both sides of the equation: how many kilowatt-hours were used and what each part of the bill charged for them.
Sources
ISO New England. “2025 Forecast Performance.” September 26, 2025. https://www.iso-ne.com/static-assets/documents/100027/2025_fx_performance_final.pdf.
ISO New England. “Load Forecast.” Accessed September 22, 2026. https://www.iso-ne.com/system-planning/system-forecasting/load-forecast.
Massachusetts Department of Public Utilities. “Understanding Your Electric Bill.” Updated July 20, 2026. https://www.mass.gov/info-details/understanding-your-electric-bill.
National Oceanic and Atmospheric Administration, Climate Prediction Center. “ENSO Diagnostic Discussion.” September 10, 2026. https://www.cpc.ncep.noaa.gov/products/analysis_monitoring/enso_advisory/ensodisc.shtml.
U.S. Department of Energy. “Community Solar Basics.” Accessed September 22, 2026. https://www.energy.gov/cmei/systems/community-solar-basics.
U.S. Energy Information Administration. “2024 Residential Energy Consumption Survey: Survey Data.” Accessed September 22, 2026. https://www.eia.gov/consumption/residential/data/2024/.
U.S. Energy Information Administration. “More U.S. Homes Used LEDs over Other Bulb Types for Indoor Lighting in 2024.” Today in Energy, March 23, 2026. https://www.eia.gov/todayinenergy/detail.php?id=67368.
U.S. Energy Information Administration. “Prices and Factors Affecting Prices.” Electricity Explained. Accessed September 22, 2026. https://www.eia.gov/energyexplained/electricity/prices-and-factors-affecting-prices.php.
U.S. Energy Information Administration. “Table CE8.5.M.2020: Monthly Household Site Electricity Consumption in the United States—Averages, 2020.” Accessed September 22, 2026. https://www.eia.gov/consumption/residential/data/2020/c&e/pdf/CE8.5.M.2020.AverageSiteElectricityConsumption.pdf.
U.S. Energy Information Administration. “Table CE8.7.M.2020: Monthly Household Site Electricity Cooling Consumption in the United States—Averages, 2020.” Accessed September 22, 2026. https://www.eia.gov/consumption/residential/data/2020/c&e/pdf/CE8.7.M.2020.AverageSpaceCoolingElectricityConsumption.pdf.
U.S. Energy Information Administration. “2020 Residential Energy Consumption Survey: Air Conditioning by State.” Accessed September 22, 2026. https://www.eia.gov/consumption/residential/data/2020/state/pdf/State%20Air%20Conditioning.pdf.
U.S. Energy Information Administration. “2020 Residential Energy Consumption Survey: Main Space-Heating Fuel by State.” Accessed September 22, 2026. https://www.eia.gov/consumption/residential/data/2020/state/pdf/State%20Space%20Heating%20Fuels.pdf.