
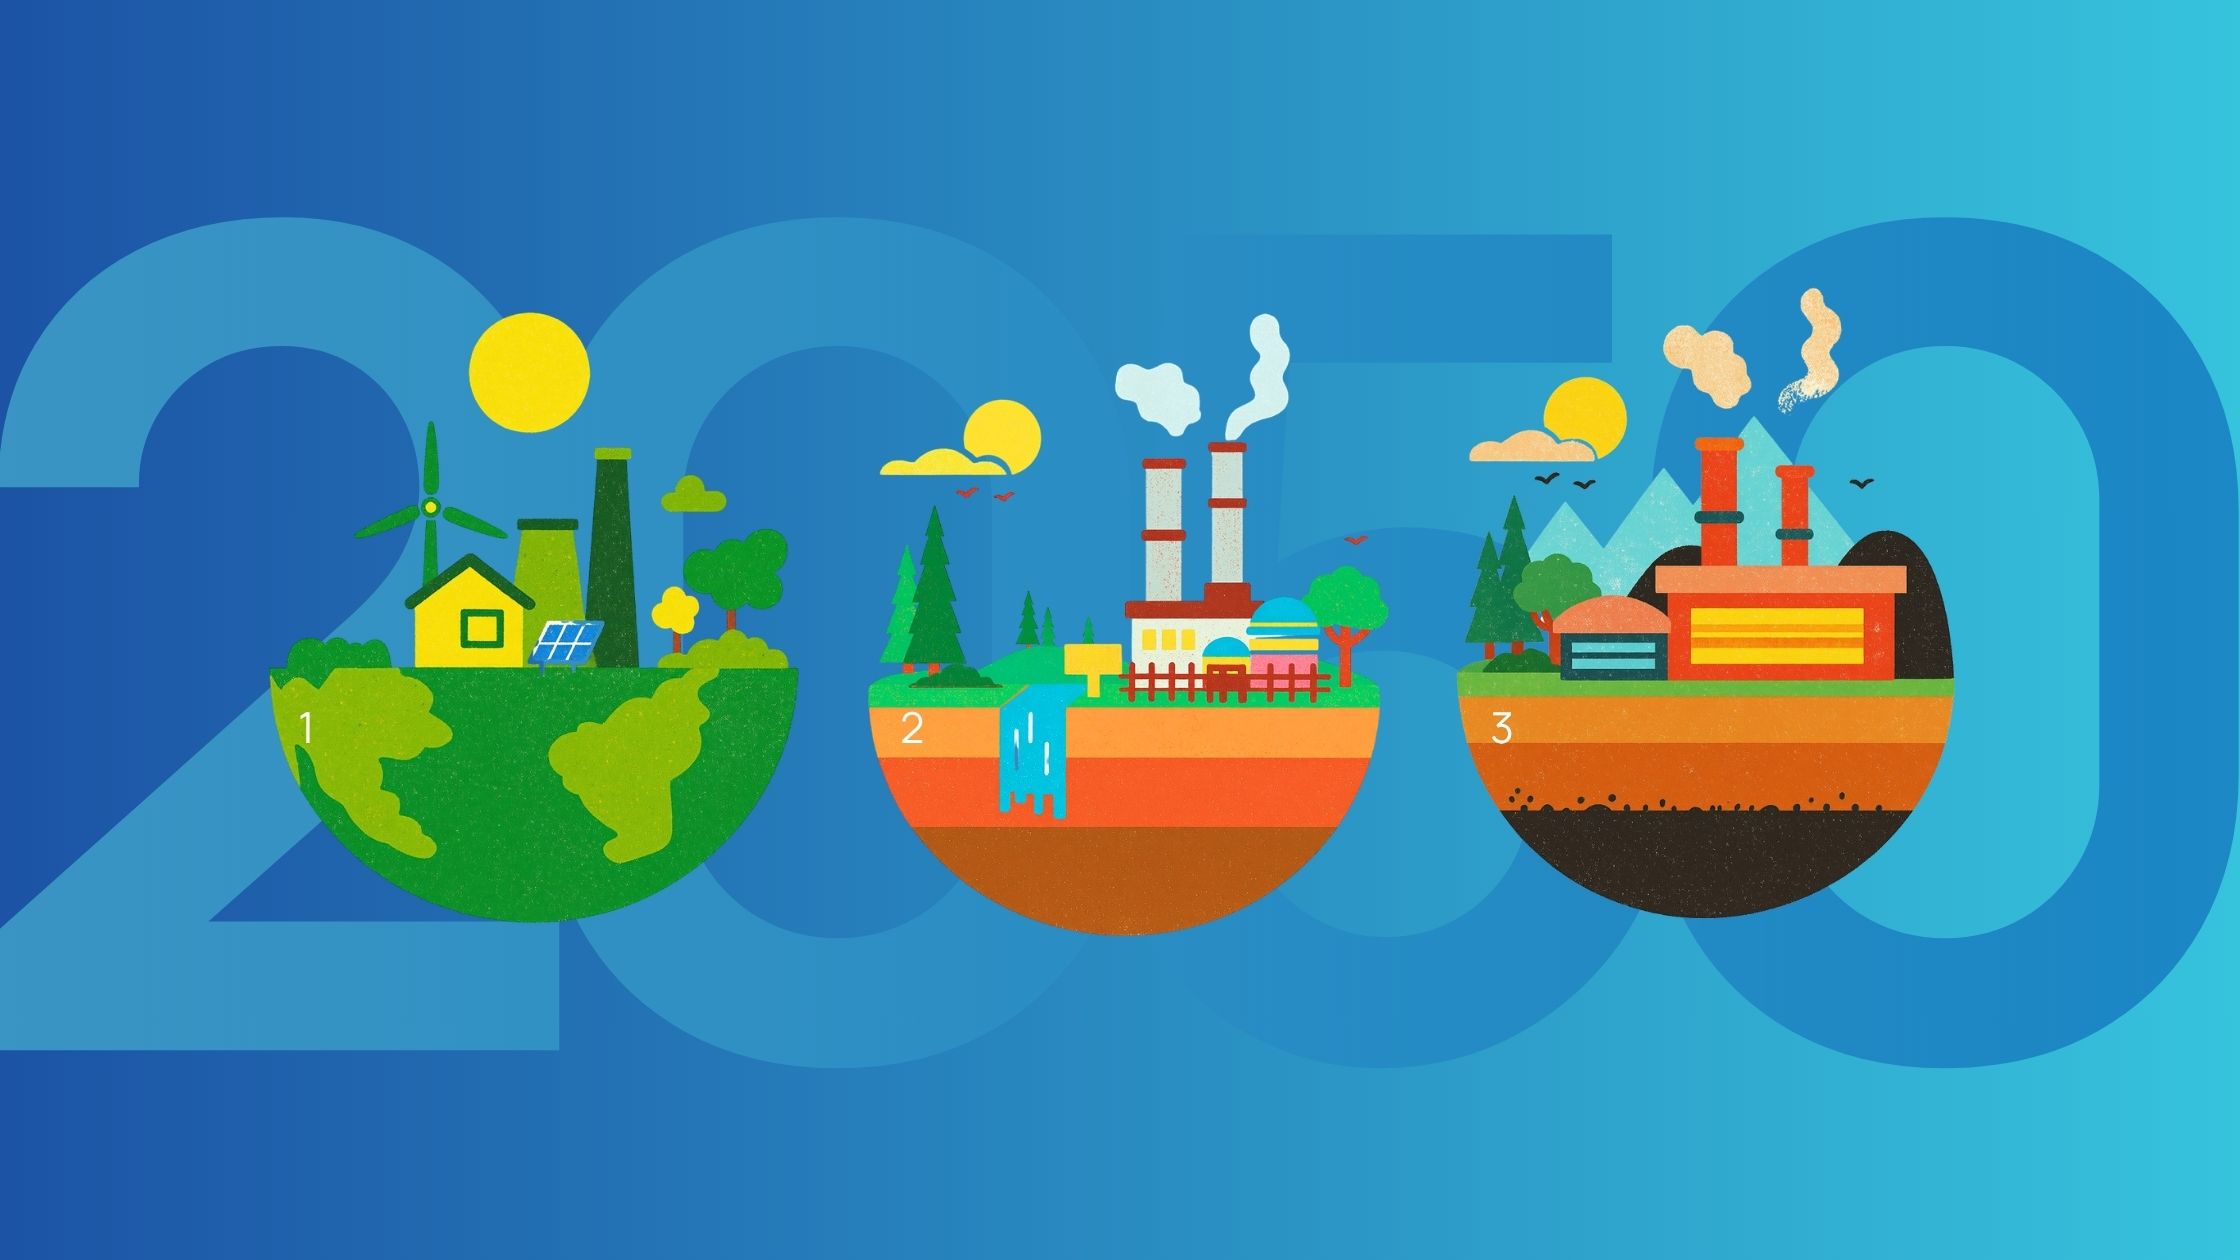
What would it take to have a clean energy future? One of the first steps is to lay out a few scenarios from ideal to worst case. From there, we can begin to understand the gap between our current trajectory and where we’d like to end up.
By 2050, America may need somewhere between 5.6 and 8 trillion kWh of electricity a year, compared with roughly 4.5 trillion kWh today. The cleanest path gets us there with solar, wind, storage, nuclear, flexible demand, and a modernized grid. The middle path cuts emissions but keeps gas as a major crutch. The worst path electrifies the economy without cleaning the grid — meaning we use more power, but fail to make it meaningfully cleaner.
First: How Much Power Will the U.S. Need?
As a baseline, the U.S. generated about 4.43 trillion kWh of utility-scale electricity in 2025, according to the Energy Information Administration. Plus, there is an estimated 0.09 trillion kWh from small-scale solar, so today’s total is roughly 4.5 trillion kWh/year.
The Annual Energy Outlook 2026 from the EIA says U.S. electricity consumption is projected to keep growing through 2050 at 0.9% to 1.6% per year, with data centers a major driver. Using that EIA growth range on today’s ~4.5 trillion kWh base, 2050 electricity demand lands roughly around:
- Low-growth case: about 5.6 trillion kWh/year
- Higher-growth EIA case: about 6.7 trillion kWh/year
- Aggressive electrification / AI / data-center case: closer to 8 trillion kWh/year if demand rises ~78% by 2050, as cited in Pew’s summary of ICF analysis.
That means the U.S. likely needs the equivalent of one-quarter to nearly one additional grid by 2050 — and in a more electrified future, possibly closer to almost doubling the amount of electricity delivered today.
The demand drivers are pretty clear: AI/data centers, EVs, electric heating, industrial reshoring, manufacturing, and broader electrification. This lines up with both EIA’s 2050 outlook and PureSky’s internal assessment, which point to data centers, electrification of transportation and buildings, industrial development, storage, demand flexibility, and grid modernization as central reliability issues.
Scenario 1: Ideal — Fully Sustainable, High-Electrification America
What Does a Clean Energy Future Look Like
In the ideal 2050 scenario, America uses much more electricity, but far less fossil fuel overall because transportation, heating, and some industrial processes have been electrified. The grid is not just “more renewable”; it is smarter, more distributed, more flexible, and designed around clean power plus storage.
A credible fully sustainable 2050 grid would likely need 6.5–8 trillion kWh/year of electricity, depending on how deeply transportation, buildings, and industry electrify. This range is consistent with EIA’s projected electricity growth through 2050 and higher-demand projections that account for electrification and data centers.
Illustrative 2050 Energy Mix: Sustainable Future
| Source | Ideal 2050 share | What it means |
|---|---|---|
| Solar, including utility, community, rooftop | 30–40% | Solar becomes one of the backbone resources, especially paired with storage. |
| Wind, onshore + offshore | 30–40% | Wind balances solar seasonally and geographically. |
| Nuclear | 10–15% | Existing nuclear plus some new firm clean capacity supports reliability. |
| Hydro, geothermal, biomass / other clean firm | 5–10% | Smaller but valuable always-on clean resources. |
| Long-duration storage, batteries, VPPs | Not generation, but essential | Storage shifts clean power across hours, days, and seasons. |
| Fossil fuels | 0–5% | Either eliminated or limited to backup with carbon capture / offsets. |
This kind of system is not fantasy, but it is a major buildout. NREL’s 100% clean electricity study found that wind and solar could provide 60%–80% of generation in a least-cost 2035 clean-grid scenario, with overall generation capacity growing to roughly three times 2020 levels, including a combined 2 terawatts of wind and solar. NREL also found that reaching 100% clean electricity would require much more storage — including 120–350 GW of diurnal storage and significant seasonal storage — plus major transmission expansion.
What Has to Happen to Make This Happen
This scenario requires:
- Massive deployment of solar, wind, storage, transmission, and demand flexibility.
- Widespread use of virtual power plants, EV managed charging, smart thermostats, distributed batteries, and industrial demand response.
- Faster permitting and interconnection.
- A major transmission buildout to move clean energy from high-resource regions to load centers.
- Energy efficiency so peak demand does not explode.
This aligns neatly with the DOE report, Pathways to Commercial Liftoff: Virtual Power Plants 2025 Update, which says VPPs can help maximize existing grid infrastructure, reduce costs, and support rapid load growth; it also notes that deploying 80–160 GW of VPPs by 2030 could serve roughly 10%–20% of peak load.
The Sunny, Clean Energy Narrative
America in 2050 is powered by sunlight, wind, storage, flexible demand, and clean firm resources. Homes are all-electric or mostly electric. Cars and trucks charge when clean power is abundant. Data centers are required to procure clean, local, or time-matched energy. Community solar, rooftop solar, batteries, and VPPs make the grid more local and resilient. Fossil peaker plants are mostly gone.
This is the world where community solar is not a niche product — it is part of the basic civic infrastructure of affordable, cleaner power.
Scenario 2: Partial Sustainability — Cleaner, But Still Gas-Reliant
What Does the Middle Road Energy Scenario Look Like
This is probably the most realistic middle path if the U.S. keeps building renewables but does not solve transmission, storage, interconnection, siting, and firm clean capacity fast enough.
Electricity demand still rises to roughly 6–7.5 trillion kWh/year by 2050, but the grid is only partly decarbonized. Renewables grow a lot, coal mostly declines, but natural gas remains a major reliability and capacity resource.
Illustrative 2050 Energy Mix: Hybrid, Middle Road
| Source | Partial 2050 share | What it means |
|---|---|---|
| Solar | 20–30% | Strong growth, but curtailed in some regions due to grid bottlenecks. |
| Wind | 20–30% | Major source, but constrained by transmission and permitting. |
| Nuclear | 10–15% | Existing nuclear largely retained; limited new builds. |
| Hydro / geothermal / other | 5–8% | Helpful but not enough on its own. |
| Natural gas | 20–35% | Main balancing and reliability resource. |
| Coal / petroleum | 0–5% | Mostly retired, but some remains in lagging regions. |
This path is consistent with the direction of current energy markets: EIA reports that today’s U.S. utility-scale power mix is still about 58% fossil fuels, with natural gas alone at about 40% of generation and coal around 17%. EIA’s 2026 outlook also says natural gas, solar, and wind are expected to account for most capacity expansion in many modeled cases.
What Has to Happen to Achieve the Middle Energy Road
In this scenario, America does make progress, but unevenly:
- Solar and storage grow quickly in high-demand states.
- Gas plants remain because they are dispatchable and politically / economically easier to build than transmission.
- Some regions become very clean; others remain fossil-heavy.
- Data centers accelerate demand faster than clean supply can catch up.
- Utilities increasingly rely on gas for capacity, even as renewable energy provides more annual generation.
The Narrative: Cleaner but Not Clean Enough
America gets cleaner, but not clean enough. Electricity is more renewable than today, but the country still leans on gas to keep the lights on. The result is lower emissions than today, but persistent fossil fuel dependence, continued exposure to gas price volatility, and ongoing local air-quality impacts from combustion-based power.
This is the scenario where community solar, storage, and VPPs still matter enormously — not just as climate solutions, but as tools to reduce pressure on the grid, lower peak demand, and avoid more fossil peaker plants.
Scenario 3: Worst case — Demand Rises, but the Grid Stays as Dirty as Today
What Does the Worst-Case Energy Future Looks Like
This is the “we electrified demand but failed to clean the supply” outcome.
Electricity demand rises to 6.5–8 trillion kWh/year, but the energy mix remains close to today’s fossil-heavy structure. Since today’s utility-scale generation is about 58% fossil fuels, keeping that same dirty share while demand grows would mean the U.S. burns much more fossil fuel for power in absolute terms.
Illustrative 2050 Energy Mix: Worst Case
| Source | “Dirty today, but bigger” 2050 share | What it means |
|---|---|---|
| Natural gas | 40–45% | Gas remains the dominant electricity source. |
| Coal | 10–17% | Coal declines somewhat or remains politically protected in some regions. |
| Petroleum / other fossil | 1–3% | Mostly peaking and backup. |
| Nuclear | 15–18% | Existing fleet retained, little expansion. |
| Renewables total | 25–35% | Clean energy grows, but not fast enough to cut fossil share meaningfully. |
This is basically today’s resource mix scaled up for tomorrow’s demand. In 2025, EIA says about 58% of utility-scale U.S. electricity came from fossil fuels, about 18% from nuclear, about 19% from non-hydro renewables, and about 24% from all renewable energy sources.
What Goes Wrong in our Worst Case Energy Scenario
- Data centers and AI load grow faster than clean generation.
- Transmission and interconnection queues remain bottlenecked.
- Gas plants are built as the fastest way to meet load.
- Storage grows, but not enough to retire peakers or firm renewables.
- Coal retirements slow down.
- Customers pay for both new demand infrastructure and fossil fuel volatility.
- Emissions stay high even as the economy becomes more electric.
The Narrative: More Electric, Not More Sustainable
America becomes more electric, but not more sustainable. We plug in the cars, the data centers, the heat pumps, and the factories — but power them with a larger fossil grid. This is the climate and affordability failure case: more generation, more grid strain, more emissions, and more exposure to fuel-price swings.
What Can We Learn from These Energy Scenarios: The Big Takeaway
The U.S. is heading toward a much more electricity-intensive economy. The real question is whether that growth is met by:
- Clean electricity + storage + flexible demand
- A hybrid system where renewables grow but gas remains central
- A bigger version of today’s fossil-heavy grid
The next 25 years are not just about building more power. They are about building the right kind of power — local, affordable, renewable, flexible, and resilient. There is a clear pathway to achieve that – it’s possible. It won’t happen without a concerted effort to make it reality.
As a community solar company, PureSky is confident that community solar is one of the most practical and accessible ways to make that future real for households, businesses, municipalities, schools, and communities that cannot install solar on their own rooftops. The maturation of investment in community solar is a definitive signal in the industry. But PureSky also recognizes that community solar and solar more broadly isn’t the single and only answer to a clean energy future. It will take a mix of different energy sources and coordination and cooperation across many levels of government and businesses. Now we just need to make it so.
Resources
U.S. Energy Information Administration. Annual Energy Outlook 2026. Washington, DC: U.S. Department of Energy, 2026. Accessed July 29, 2026.
https://www.eia.gov/outlooks/aeo/
U.S. Energy Information Administration. “Electricity Generation, Capacity, and Sales in the United States.” Electricity Explained. Accessed July 29, 2026.
https://www.eia.gov/energyexplained/electricity/electricity-in-the-us-generation-capacity-and-sales.php
U.S. Energy Information Administration. “U.S. Electricity Generation in 2025 Hit a Record, Again.” Today in Energy, March 5, 2026. Accessed July 29, 2026.
https://www.eia.gov/todayinenergy/detail.php?id=67284
U.S. Department of Energy, Office of Critical Minerals and Energy Innovation. Examining Supply-Side Options to Achieve 100% Clean Electricity by 2035. Accessed July 29, 2026.
https://www.energy.gov/cmei/examining-supply-side-options-achieve-100-clean-electricity-2035
U.S. Department of Energy. Pathways to Commercial Liftoff: Virtual Power Plants 2025 Update. Washington, DC: U.S. Department of Energy, 2025. Accessed July 29, 2026.
https://liftoff.energy.gov/wp-content/uploads/2025/01/LIFTOFF_DOE_VirtualPowerPlants2025Update.pdf
Princeton University. Net-Zero America Project: Final Report. Princeton, NJ, 2021. Accessed July 29, 2026.
https://netzeroamerica.princeton.edu/the-report
Pew Charitable Trusts. “With U.S. Electricity Demand Set to Skyrocket, the Call for Solutions Accelerates.” September 12, 2025. Accessed July 29, 2026.
https://www.pew.org/en/research-and-analysis/articles/2025/09/12/with-us-electricity-demand-set-to-skyrocket-the-call-for-solutions-accelerates
BIC Magazine. “EIA Annual Energy Outlook 2026: U.S. Energy Trends to 2050.” May 12, 2026. Accessed July 29, 2026.
https://www.bicmagazine.com/industry/refining-petrochem/eia-energy-outlook-2026-signals-new-era/